

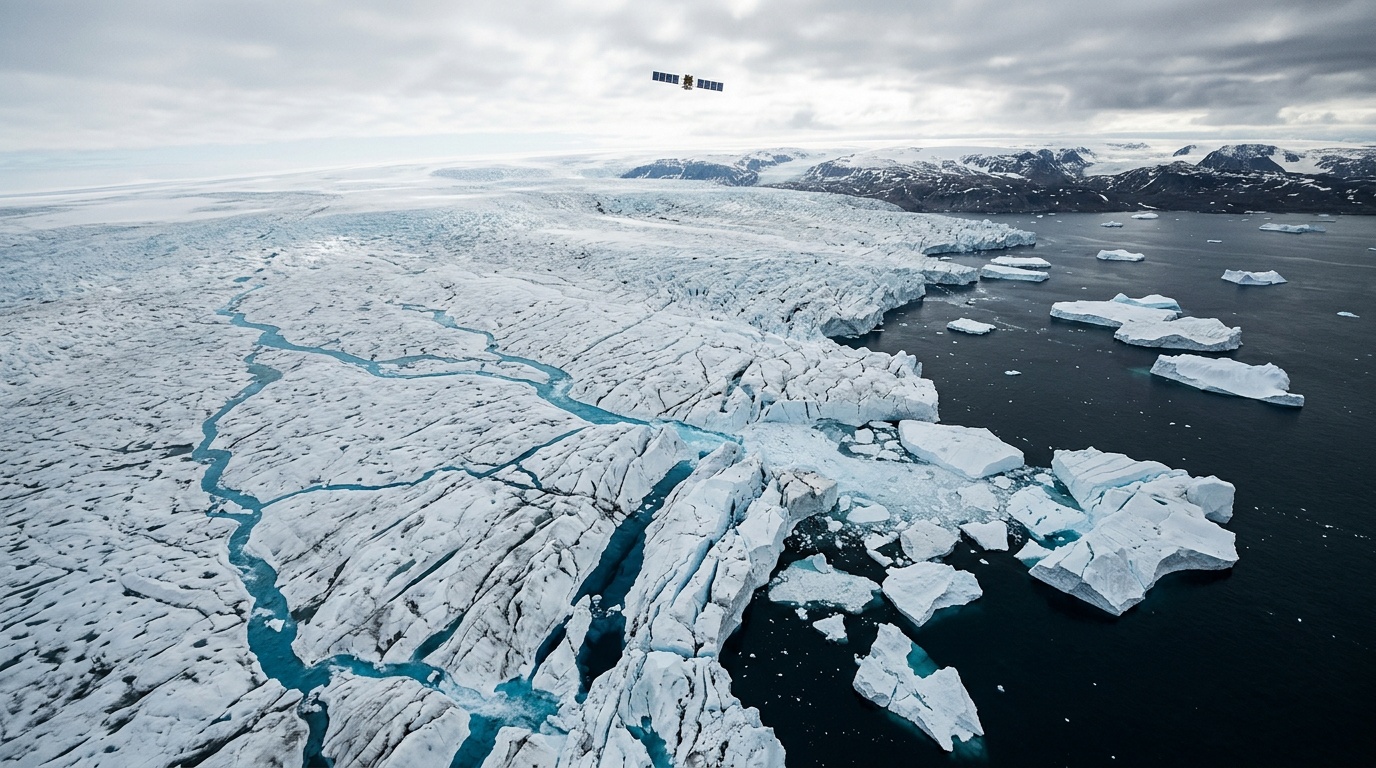
Satellite measurements have transformed scientists’ understanding of Earth’s two great ice sheets. Repeated observations reveal shrinking margins, faster glaciers, and sustained mass loss across many regions. Greenland and Antarctica contain enough frozen water to reshape coastlines worldwide. Their changing ice already raises seas and affects projections for future generations.
Unlike field stations, satellites survey remote areas repeatedly with consistent instruments. They also observe dangerous places where crevasses, storms, and extreme cold restrict ground campaigns. No single spacecraft measures every process, so researchers combine several independent techniques. Together, those records show accelerating long-term losses despite substantial yearly variation.
How satellites measure ice loss
Satellite altimeters measure changes in the ice surface’s height. Radar altimeters send microwave pulses downward and record their returning echoes. Scientists calculate elevation using each pulse’s travel time and the satellite’s precise position. The European Space Agency launched CryoSat-2 in 2010 to monitor polar ice.
Radar penetrates clouds and works during the long polar night. However, changing snow conditions can shift the radar pulse’s apparent reflection point. Researchers correct that effect using snow models, weather information, and comparisons with other instruments. Repeated tracks then reveal where the surface rises or falls.
Laser altimeters provide another detailed view of elevation. NASA operated ICESat from 2003 to 2009 and launched ICESat-2 in 2018. ICESat-2 fires rapid laser pulses along precise orbital tracks. Its measurements resolve fine surface features, although clouds can interrupt observations.
Weighing ice through gravity
Gravity missions effectively weigh the ice sheets from space. NASA and German partners operated GRACE between 2002 and 2017. GRACE Follow-On resumed those measurements in 2018 after a short gap. Both missions detect tiny distance changes between paired spacecraft caused by variations in Earth’s gravity.
Ice loss slightly weakens the regional gravitational field. Researchers use that signal to estimate total mass changes across broad areas. Gravimetry cannot identify every individual glacier because its spatial resolution remains relatively coarse. However, it detects mass changes that elevation measurements might misinterpret.
Tracking movement from orbit
Optical satellites, including Landsat, document changes along glacier fronts and ice-sheet margins. Radar satellites can observe through clouds and darkness. Researchers compare successive images to calculate ice speed and flow direction. Faster flow often increases discharge where glaciers deliver ice into the ocean.
Satellite radar also maps grounding lines, where grounded ice begins floating as an ice shelf. Changes at these boundaries reveal how oceans affect inland ice. Retreating grounding lines can expose thicker ice to seawater and increase glacier flow. Velocity records therefore connect measured losses with physical changes near the coast.
Converting observations into mass
A falling surface does not always represent lost ice. Fresh snow gradually compacts into denser firn and eventually becomes glacier ice. Temperature, snowfall, wind, and meltwater alter that process. Scientists use firn models to separate compaction from genuine mass loss.
Researchers must also distinguish snowfall gains from melting and glacier discharge. An ice sheet gains mass through snowfall and loses it through several pathways. These pathways include runoff, evaporation, basal melting, and iceberg production. Combining satellite records allows teams to estimate the complete balance.
Gravity estimates require additional corrections for movements beneath the ice. Earth’s mantle still responds to ice removed after the last glacial period. This process, called glacial isostatic adjustment, changes the gravity field slowly. Scientists model it using geological evidence, seismology, and satellite positioning data.
Each method carries different uncertainties, but their results increasingly agree. Altimetry identifies where thinning occurs, while gravimetry measures broad mass changes. Imagery shows whether faster flow accompanies those losses. This agreement gives researchers greater confidence in the overall trend.
The evidence for acceleration
The Ice Sheet Mass Balance Inter-comparison Exercise combines estimates from numerous satellite teams. Researchers call the international project IMBIE. Its assessment found that Greenland and Antarctica lost about 7.56 trillion metric tonnes between 1992 and 2020. That loss raised global mean sea level by approximately 21 millimeters.
Combined annual losses increased from about 105 billion tonnes during 1992–1996. They reached about 372 billion tonnes during 2016–2020. This increase represents more than a threefold rise across the assessment periods. The highest-loss years have concentrated within the later satellite record.
Acceleration does not mean losses increase smoothly every year. Weather patterns produce strong seasonal and annual swings. Heavy snowfall can temporarily offset discharge, while exceptional warmth can create severe summer losses. Long satellite records separate those short fluctuations from the underlying decline.
Greenland’s changing surface and glaciers
Greenland loses ice through surface runoff and the discharge of marine-terminating glaciers. Warmer air lengthens the melting season and exposes darker, older ice. Dark surfaces absorb more sunlight than fresh snow, which encourages additional melting. Meltwater then drains through streams, lakes, cracks, and channels.
Satellites detected surface melting across nearly all Greenland during a brief period in July 2012. Another exceptionally warm season produced major losses in 2019. Such extremes do not occur every year, but they demonstrate the ice sheet’s sensitivity. Persistent warming increases the likelihood of damaging melt seasons.
Greenland’s outlet glaciers also respond to ocean temperatures and changing fjords. Several glaciers have retreated, thinned, and accelerated during the satellite era. Individual glaciers sometimes slow after their fronts stabilize on shallow seabed features. Nevertheless, Greenland’s overall mass balance remains strongly negative.
Antarctica’s regional contrasts
Antarctica shows a more complicated pattern because its regions respond differently. West Antarctica accounts for much of the continent’s measured loss. Glaciers entering the Amundsen Sea, including Thwaites and Pine Island, have retreated rapidly. Relatively warm ocean water attacks their floating ice shelves from below.
Floating shelves already displace seawater, so their melting adds little directly to sea level. However, those shelves restrain grounded glaciers flowing behind them. Thinner or fractured shelves provide less resistance, allowing inland ice to accelerate. Satellites can measure both shelf thinning and the resulting speed changes.
East Antarctica remains closer to balance overall, partly because snowfall offsets some losses. However, several coastal basins have lost ice, and significant uncertainties remain. The Antarctic Peninsula has also experienced glacier retreat and major shelf collapses. These regional differences make continent-wide averages insufficient by themselves.
Why the losses can accelerate
Several feedbacks can amplify ice loss after warming begins. Lower ice surfaces encounter warmer air, which promotes further melting. Darkened snow and exposed ice absorb additional solar energy. Meltwater can also weaken ice shelves by enlarging surface cracks.
Antarctic glaciers face another risk where their beds deepen inland. Grounding-line retreat can expose progressively thicker ice to flotation and ocean heat. That geometry may sustain retreat even without continuously increasing ocean temperatures. Scientists call this process marine ice-sheet instability.
Consequences for global sea level
Roughly 360 billion tonnes of land ice loss raises global mean sea level by one millimeter. Greenland and Antarctica therefore influence coastlines far beyond the polar regions. Thermal expansion and melting mountain glaciers also contribute to rising seas. Satellites help researchers separate these overlapping sources.
Sea-level change does not occur evenly around the planet. Losing ice reduces an ice sheet’s gravitational pull on nearby ocean water. Land can also rise as the weight disappears. Consequently, distant tropical and mid-latitude coastlines may experience above-average effects from polar losses.
Maintaining the satellite record
Uncertainty still surrounds snowfall, firn density, bedrock motion, and conditions beneath ice shelves. Clouds hinder lasers, steep terrain complicates radar echoes, and gravity missions provide coarse regional detail. Researchers address these limitations through overlapping missions and independent methods. Aircraft, field instruments, and ocean measurements provide essential checks.
Continuous observations remain crucial because ice sheets respond over years, decades, and centuries. Satellite records test computer models and expose missing processes. They also help governments plan coastal defenses and assess future risks. The combined evidence now shows that both ice sheets require sustained global monitoring.
