

A larger river pathway to the sea
Scientists have long recognized rivers as major routes for plastic waste entering seas. New measurements now indicate that many rivers transport much more microplastic than earlier surveys captured. Researchers find particles across the water column, during floods, and below common sampling limits. These findings expand the estimated flow without proving that earlier surveys underestimated every river.
Microplastics measure less than five millimeters, although researchers use different lower size limits. Manufacturers intentionally make some particles, including industrial pellets and certain cosmetic ingredients. Larger products create secondary microplastics as sunlight, heat, abrasion, and movement weaken them. Rivers receive both forms from streets, drains, soils, sewage systems, and discarded waste.
Why traditional surveys miss particles
Surface sampling reveals only part
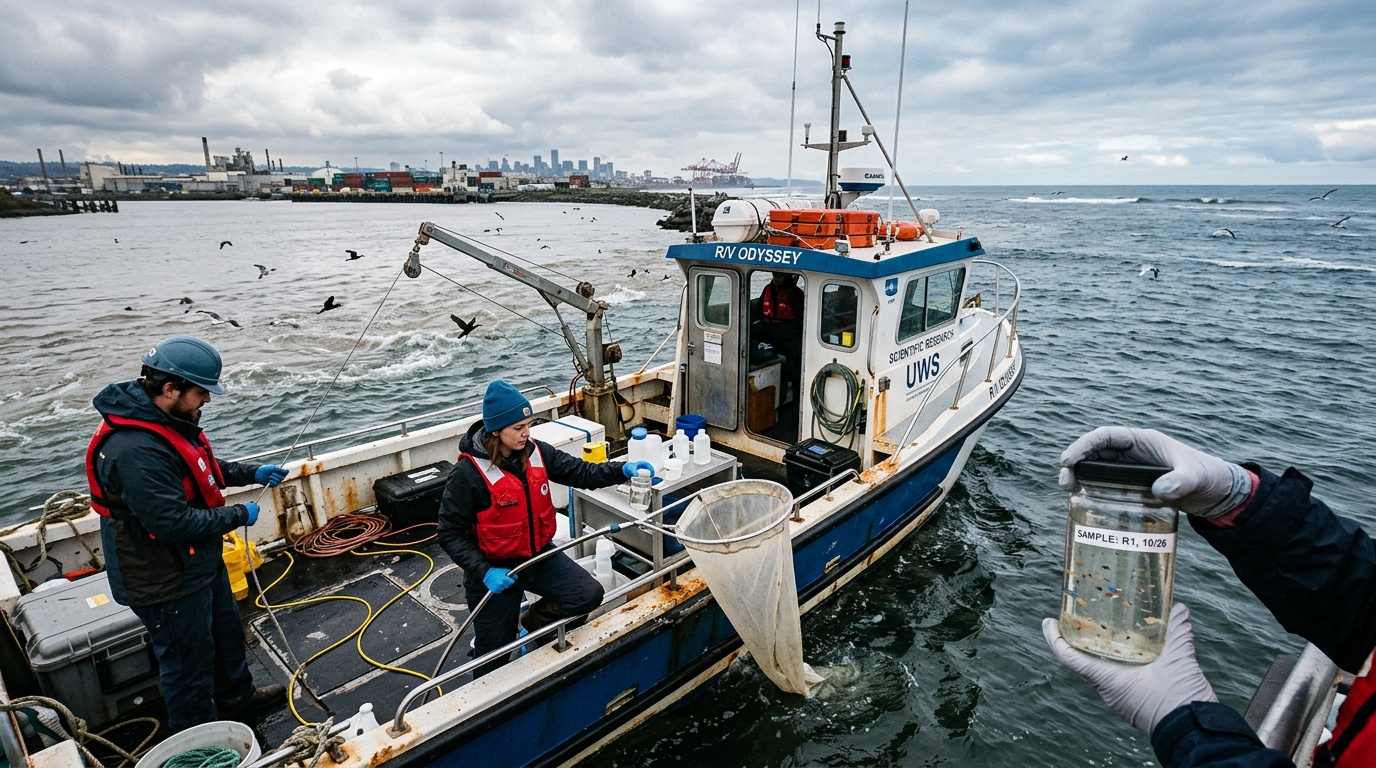
Many monitoring programs tow fine-mesh nets across the surface or collect small grab samples. Nets can miss particles below their mesh size and material moving beneath the surface. Grab samples provide valuable snapshots, but they rarely capture rapid changes across an entire channel. Scientists therefore combine several methods to calculate fuller loads.
Researchers estimate a river’s export by multiplying concentration by water discharge over time. Small errors grow when samplers miss deep water or very small particles. Sparse measurements can also misrepresent seasonal rivers with highly variable flows. Better coverage often raises calculated totals because it includes overlooked transport.
Floods deliver short, powerful pulses
Storms wash roadside dust, litter, soil, and sewer overflows into waterways. Rising water also erodes banks and remobilizes particles stored in riverbed sediment. Consequently, a few high-flow days may carry a large share of annual microplastic export. Sampling only during calm weather can produce a serious underestimate.
Flood monitoring remains difficult because fast water threatens equipment and changes channels quickly. Automated samplers help, but filters can clog during sediment-rich events. Researchers must sample frequently enough to follow both the rising and falling flood. Those practical limits still create wide uncertainty around annual river loads.
Revised maps change global understanding
Early global models linked mismanaged plastic waste, rainfall, terrain, and river discharge to ocean inputs. They provided essential first estimates where field data remained scarce. However, their assumptions simplified local drainage, dams, waste collection, and plastic retention. Newer models use finer river networks and more observations to revise those patterns.
A widely cited 2017 study estimated rivers delivered 1.15 million to 2.41 million tonnes of plastic annually. That estimate covered plastic broadly, not identical microplastic size ranges across every dataset. A 2021 analysis estimated 0.8 million to 2.7 million tonnes. Different definitions and modeling choices prevent simple comparisons between those ranges.
The 2021 work also challenged the belief that ten giant rivers dominate ocean plastic delivery. The analysis found over 1,000 rivers account for 80 percent of riverine emissions to oceans. Many are small, urban rivers near coasts, where waste reaches saltwater quickly. This wider distribution changes where monitoring and prevention can achieve results.
Yet models still struggle with the smallest microplastics, and most exclude nanoplastics entirely. Laboratory identification becomes slower and costlier as particle size declines. Fibers also create counting problems because airborne contamination can enter samples. Therefore, reported loads usually represent measured size classes, not every plastic particle present.
Where river microplastics originate
Cities create concentrated inputs
Tyres shed synthetic rubber and chemical additives as vehicles brake and turn. Rain carries this wear into drains, streams, and rivers. Paint flakes, artificial turf, construction materials, packaging, and textile fibers add further particles. Dense pavement accelerates runoff and shortens the route between sources and water.
Wastewater plants remove many microplastics through settling and filtration, especially larger particles. However, treated effluent can still release enormous particle numbers because plants process vast water volumes. Combined sewers may overflow during heavy rain, bypassing normal treatment. Poorly managed sewage creates still greater releases in many regions.
Rural landscapes also contribute
Agricultural soils receive plastic from mulch films, greenhouse covers, coated fertilizers, and contaminated organic amendments. Weathering breaks exposed material into fragments that runoff can transport. Rivers may also collect fibers deposited from the atmosphere across remote catchments. These pathways show that visible litter represents only one part of the problem.
Waste systems strongly influence each catchment’s emissions. Regular collection, controlled disposal, and drain maintenance reduce material available for transport. Open dumping near channels creates the opposite conditions. Geography matters too, since short, steep rivers can move debris rapidly before it becomes trapped.
Estuaries can trap and release plastic
A river mouth does not function like a simple pipe. Changing salinity can alter particle aggregation and interactions with natural sediment. Tides push particles upstream, while currents distribute others along coasts. Wetlands, mudflats, reservoirs, and estuarine beds may store plastic for years.
Storage delays ocean delivery but does not always prevent it. Dredging, floods, waves, or biological activity can remobilize buried particles. Researchers must therefore distinguish river transport from immediate ocean entry. Long-term budgets need measurements in water, sediment, shorelines, and estuarine organisms.
Why higher loads matter
Marine animals encounter microplastics through water, food, and seafloor sediment. Many species ingest particles, from plankton to fish and seabirds. Experiments report physical stress, reduced feeding, inflammation, or chemical effects under some conditions. Ecological consequences depend on dose, particle properties, species, and surrounding pollutants.
Scientists still debate how laboratory results translate to wild populations and human health. That uncertainty does not mean exposure lacks importance. Microplastics persist, spread widely, and mix with complex chemical and biological communities. Preventing releases avoids future contamination that cleanup cannot easily reverse.
Better evidence and practical action
Researchers need harmonized methods for sampling, identification, quality control, and load calculations. Teams should report mesh sizes, detection limits, flow conditions, and contamination checks. Monitoring should span depths, seasons, ordinary flows, and major floods. Shared standards would make rivers and studies easier to compare.
Useful tools include automated samplers, spectroscopic imaging, flow sensors, and models calibrated with field measurements. Scientists can pair water samples with sediment traps and estuary surveys. They also need data from underrepresented regions with weak waste services. Broader evidence will narrow uncertainty and test claims of underestimated transport.
Governments can reduce inputs by improving waste collection and stopping leakage near waterways. Cities can capture stormwater solids and manage sewer overflows. Product standards can limit avoidable microplastic releases from tyres, textiles, paints, and industrial pellets. Producers can also design durable products that shed less material.
The emerging evidence does not produce one final number for every river. Instead, it shows why earlier snapshots often missed substantial transport. Tiny particles, deep flows, floods, and numerous coastal rivers all enlarge the measured pathway. Better monitoring refines estimates, while immediate, coordinated prevention can reduce the plastic load entering oceans each year.
